bike setup, cycling, Fixed gear, gain ratio, gearing, technical, track, track cycling
JT
0 Comments
239 Views
Gearing for Track Racing Explained
On the velodrome, one of the first things new riders learn is that getting your gearing right is important. Too high and you will struggle to get on top of your gear when accelerating from a low pace. Too low and you will struggle with the surges of racing when the pace remains high. In track racing, each of these factors has a decisive impact and each is effected by gear selection. Finding a sweet spot requires an understanding of pace that you will have to race at, and an understanding of your gear options. Having a gear chart specific to you and your bike is the first step in understanding your gear selection.
Rather than jump straight in to a discussion on gearing it would be appropriate to briefly discuss the characteristics of the various endurance events. Specifically, what kind of cadences are we dealing with and why? I’ve used the elite and world class level events as examples because this is generally where most of the data is. However all grades of racing below this level share similar characteristics despite having lower speeds.
It is not uncommon for the speed of an elite track race to drop down to 45km/h as riders recover, accelerate back up to 60km/h as riders attack and then hit over 65km/h in the final sprint. The ebbs and flows of a race see this happen throughout and it’s not just the elite categories that see such wide variations in speed. The overall high pace (high aerobic intensity) and the requirement to put in hard anaerobic efforts during surges and sprints, see huge demand on both neuromuscular and cardiovascular systems.
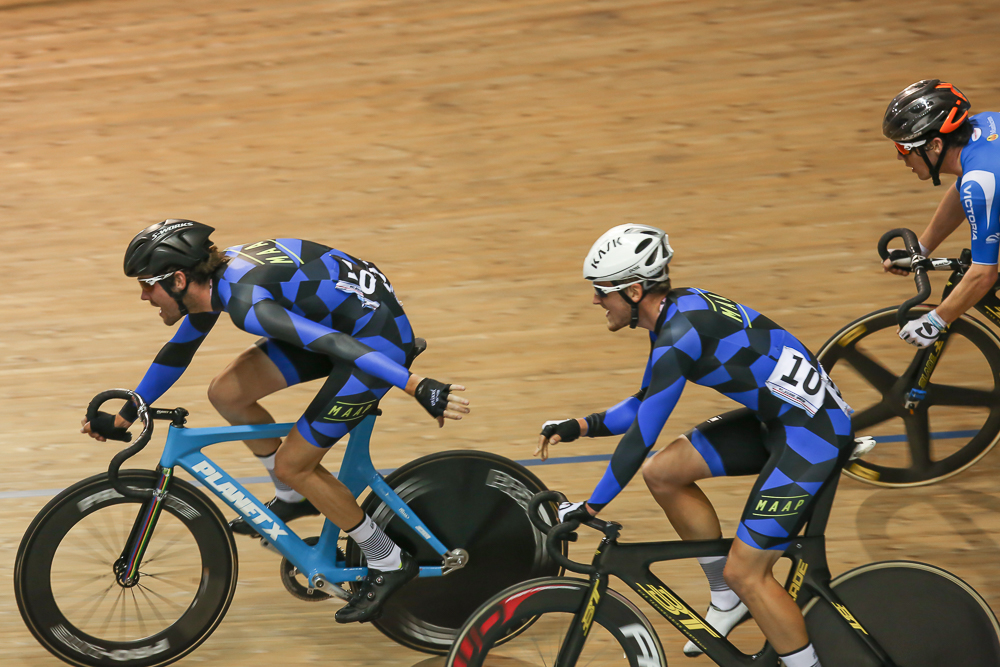
Most elite track riders race at 105-115 rpm with spurts up around 130-140 rpm. It goes without saying that being able to effectively produce power at these higher levels is a key component that goes into making a good track rider as these cadences go with the territory of racing a fixed gear. Let’s take a scratch race which is probably the most “road like” of all the track events. Assuming an elite class rider runs a 54×14 (101 inch) gear, and the race averages 50km/h this equates to an average cadence of around 105 rpm with cadences above and below this level. However this average cadence is unimportant. Cadence at the decisive moments in racing is what is important. What are the decisive moments in racing? That depends on the type of race and the quality of the field and is best explained by an example.
At the recent World Championships in London the decisive moment in the Men’s Madison was the late attack by Wiggins in the final 30 laps which saw the British pair (Wiggins & Cavendish) take a lap on the field after leading on points yet being a lap down and hence being out of medal contention. In that race, as in any Madison the gear choice for those decisive moments was important. The cadence sweet spot was defined by Wiggo’s attack at the intensity required to take a lap, for the duration of the effort – in this case 17 laps. This effort would have been at an intensity up around VO2max.
A well trained track cyclist will be more accustomed to performing high-intensity (VO2max intensity) and supramaximal intensity (above VO2max) work in a higher cadence range than most road cyclists will be. Irrespective of how well “cadence conditioned” an athlete may be, finding the sweet spot is dependent on the duration the bouts (surges) experienced during the race.
Speaking in Gear Inches
(online gear ratio calculation spreadsheet found here)
For a given gear inch number, there are several gear combinations that are almost the same if not the same. Track riders use gear inches as a convenient and quick measure for expressing the mechanical advantage provided by a set of gear combinations.
| Gear Inches | ||||||||
| RearFront | 48 | 49 | 50 | 51 | 52 | 53 | 54 | 55 |
|---|---|---|---|---|---|---|---|---|
| 12 | 105.5 | 107.7 | 109.9 | 112.1 | 114.3 | 116.5 | 118.7 | 120.9 |
| 13 | 97.4 | 99.4 | 101.4 | 103.5 | 105.5 | 107.5 | 109.6 | 111.6 |
| 14 | 90.4 | 92.3 | 94.2 | 96.1 | 98.0 | 99.8 | 101.7 | 103.6 |
| 15 | 84.4 | 86.2 | 87.9 | 89.7 | 91.4 | 93.2 | 95.0 | 96.7 |
| 16 | 79.1 | 80.8 | 82.4 | 84.1 | 85.7 | 87.4 | 89.0 | 90.7 |
| 17 | 74.5 | 76.0 | 77.6 | 79.1 | 80.7 | 82.2 | 83.8 | 85.3 |
| Wheel Diameter (inches) | 26.375 | |||||||
The formula for calculating the gear inches provided by a gear combination is simply:
It is important to note that this formula does not provide the number of inches travelled by the wheel with one revolution of the crank. Instead, it is simply represents a consistent and relative way of expressing each gear combination. To work out the actual distance you will travel with one revolution of the crank simply multiply the result from the gear inch formula above by 0.07981 (0.07981 = Pi ÷ 39.3701 where Pi = 3.142 and 39.3701 inches = 1 meter). This is particularly useful for Junior riders who are often required to race on gear rollouts below a certain distance.
| Gear Rollout in Meters | ||||||||
| RearFront | 48 | 49 | 50 | 51 | 52 | 53 | 54 | 55 |
|---|---|---|---|---|---|---|---|---|
| 12 | 8.4 | 8.6 | 8.8 | 8.9 | 9.1 | 9.3 | 9.5 | 9.6 |
| 13 | 7.8 | 7.9 | 8.1 | 8.3 | 8.4 | 8.6 | 8.7 | 8.9 |
| 14 | 7.2 | 7.4 | 7.5 | 7.7 | 7.8 | 8.0 | 8.1 | 8.3 |
| 15 | 6.7 | 6.9 | 7.0 | 7.2 | 7.3 | 7.4 | 7.6 | 7.7 |
| 16 | 6.3 | 6.4 | 6.6 | 6.7 | 6.8 | 7.0 | 7.1 | 7.2 |
| 17 | 5.9 | 6.1 | 6.2 | 6.3 | 6.4 | 6.6 | 6.7 | 6.8 |
| Wheel Diameter (mm) | 669.925 | |||||||
| Wheel Circumference (mm) | 2104.631 | |||||||
Now that we’ve calculated our gear ratios let’s see how these translate into cadence for a given speed. This table displays the cadence required to achieve a given speed for a given gear. in this example I have used a number of gear ratios for a 14 tooth rear cog.
| Gear Inches / Speed to Cadence | ||||||
| InchesSpeed | 40 | 45 | 50 | 55 | 60 | 65 |
|---|---|---|---|---|---|---|
| 86.0 | 97.1 | 109.3 | 121.4 | 133.6 | 145.7 | 157.9 |
| 88.0 | 94.9 | 106.8 | 118.7 | 130.5 | 142.4 | 154.3 |
| 90.0 | 92.8 | 104.4 | 116.0 | 127.6 | 139.2 | 150.8 |
| 92.0 | 90.8 | 102.2 | 113.5 | 124.9 | 136.2 | 147.6 |
| 94.0 | 88.9 | 100.0 | 111.1 | 122.2 | 133.3 | 144.4 |
| 96.0 | 87.0 | 97.9 | 108.8 | 119.7 | 130.5 | 141.4 |
| 98.0 | 85.3 | 95.9 | 106.6 | 117.2 | 127.9 | 138.5 |
| 100.0 | 83.5 | 94.0 | 104.4 | 114.9 | 125.3 | 135.8 |
| 102.0 | 81.9 | 92.1 | 102.4 | 112.6 | 122.9 | 133.1 |
| 104.0 | 80.3 | 90.4 | 100.4 | 110.5 | 120.5 | 130.5 |
| 106.0 | 78.8 | 88.7 | 98.5 | 108.4 | 118.2 | 128.1 |
You can quickly see that cadences quickly ramp up as speeds increase. In fact, during the course of a regular race there is a wide variation in cadence. As a result, riders need to be conditioned to produce high power outputs at a variety of cadences to meet a number of difference race scenarios.
Although these charts uses 26.375 inches as the 700c wheel diameter equivalent, be aware that different tyres and air pressures will produce slightly different diameter values. Not to worry, in the next section below I have detailed a simple way to calculate your true wheel diameter. Simply plug the value calculated into the spreadsheet included with this article at the bottom of the page or follow this link.
The “correct” way to calculate wheel circumference
Different tyres and different tyre widths give different wheel diameters. Accurately obtaining your wheel circumference is a fairly easy exercise with the help of a friend and smooth, flat piece of pavement:
- Install your race wheels and tyres on your bike.
- Pump the tyres up to race pressure.
- Make a mark on the pavement and a mark on the side of your rear tyre.
- Line up the two marks so the tyre mark is as close the ground as possible.
- Sit on your bike and role the bike forward to the rear wheel travels exactly one full revolution. Make a second mark on the ground at the point where the tyre mark is again closest to the ground.
- Measure the distance between the two marks.
Voila! You now have your actual wheel circumference which can now be used for calculating accurate gear roll outs and gear inches. This is particularly useful for riders with gear restrictions or who are looking at target cadence ranges.
Note: to calculate your wheel diameter simply divide your wheel circumference by Pi (3.142). To convert mm to inches divide your mm value by 25.4.

So which gear is best?
Remember, not all watts are created equal. Power is equal to force multiplied by the speed of movement which means we can achieve the same power in different ways and with different physiological consequences. Fitness, strength and conditioning are obviously going to be key determinants on the gear you select (and subsequent grade that you ride). At the two extremes you firstly have “neuromuscular power” – achieved through time in the gym and developing anaerobic qualities that are vital to performance on the track. Secondly you have “cadence conditioning” – the ability to pedal at a high frequency at the appropriate intensity. Incorporating both into training are vital if you want to achieve your best on the track.
The ideas presented here form a foundation from which you can start to think about gearing. Although I have used elite competition in my examples the principles are exactly the same for men and women of all divisions. When choosing a gear the bottom line is that there is no generalised “correct” gear that can be prescribed here. If you keep in mind that races with larger variations in speed (i.e. point score) will be suitable to slightly smaller gears than races with fewer variations in speed (i.e. pursuit) you are part of the way to understanding how to select a suitable gear. By knowing what speeds you will likely encounter in your race, the charts above will help you understand what kind of cadences you will experience for a given gear. This is the first step in understanding what gear will work for you.
To make it easy to get started, follow this link for a gear chart that can be referenced for selecting your gear ratios.
Share this content:
